
Your Sensors Are Talking. Is Anyone Listening?

TL;DR
- Most connected devices generate far more data than any team ever reviews or acts on, with industry estimates on IoT “dark data” ranging from roughly 70% to 90%, depending on the sector and study.
- The gap usually isn’t a hardware or connectivity problem. It’s a design problem: data gets collected without a plan for who uses it, where it goes, or what happens next.
- Closing the gap means treating collection, routing, visualization, analysis, and automated action as one continuous pipeline – not five separate projects.
Somewhere in your operation, a sensor is reporting a temperature, a location, a battery level, or a vibration pattern, and no one is looking at it. Not because the data isn’t valuable, but because nothing was ever built to notice it. It exists, technically. It was collected, transmitted, maybe even stored in a database with a retention policy someone configured once and forgot about. But it has no operational afterlife. It’s a ghost in the machine.
This is the quiet failure mode of enterprise IoT. Organizations invested heavily in getting devices online (provisioning SIMs, negotiating connectivity contracts, building or buying sensors) and treated that as the finish line when it’s actually the starting line. Estimates of how much IoT-generated data goes unused vary by source and industry, but consistently point in the same direction: a majority. IIoT World has described a “90% waste problem” in manufacturing data specifically, while other industry research puts sensor-generated data at closer to 70% of the “dark data” accumulating in manufacturing and logistics operations, according to DataStackHub. The exact figure is less important than the pattern: whether it’s seven in ten or nine in ten, most of what your devices tell you is never heard.
Why the Data Goes Dark
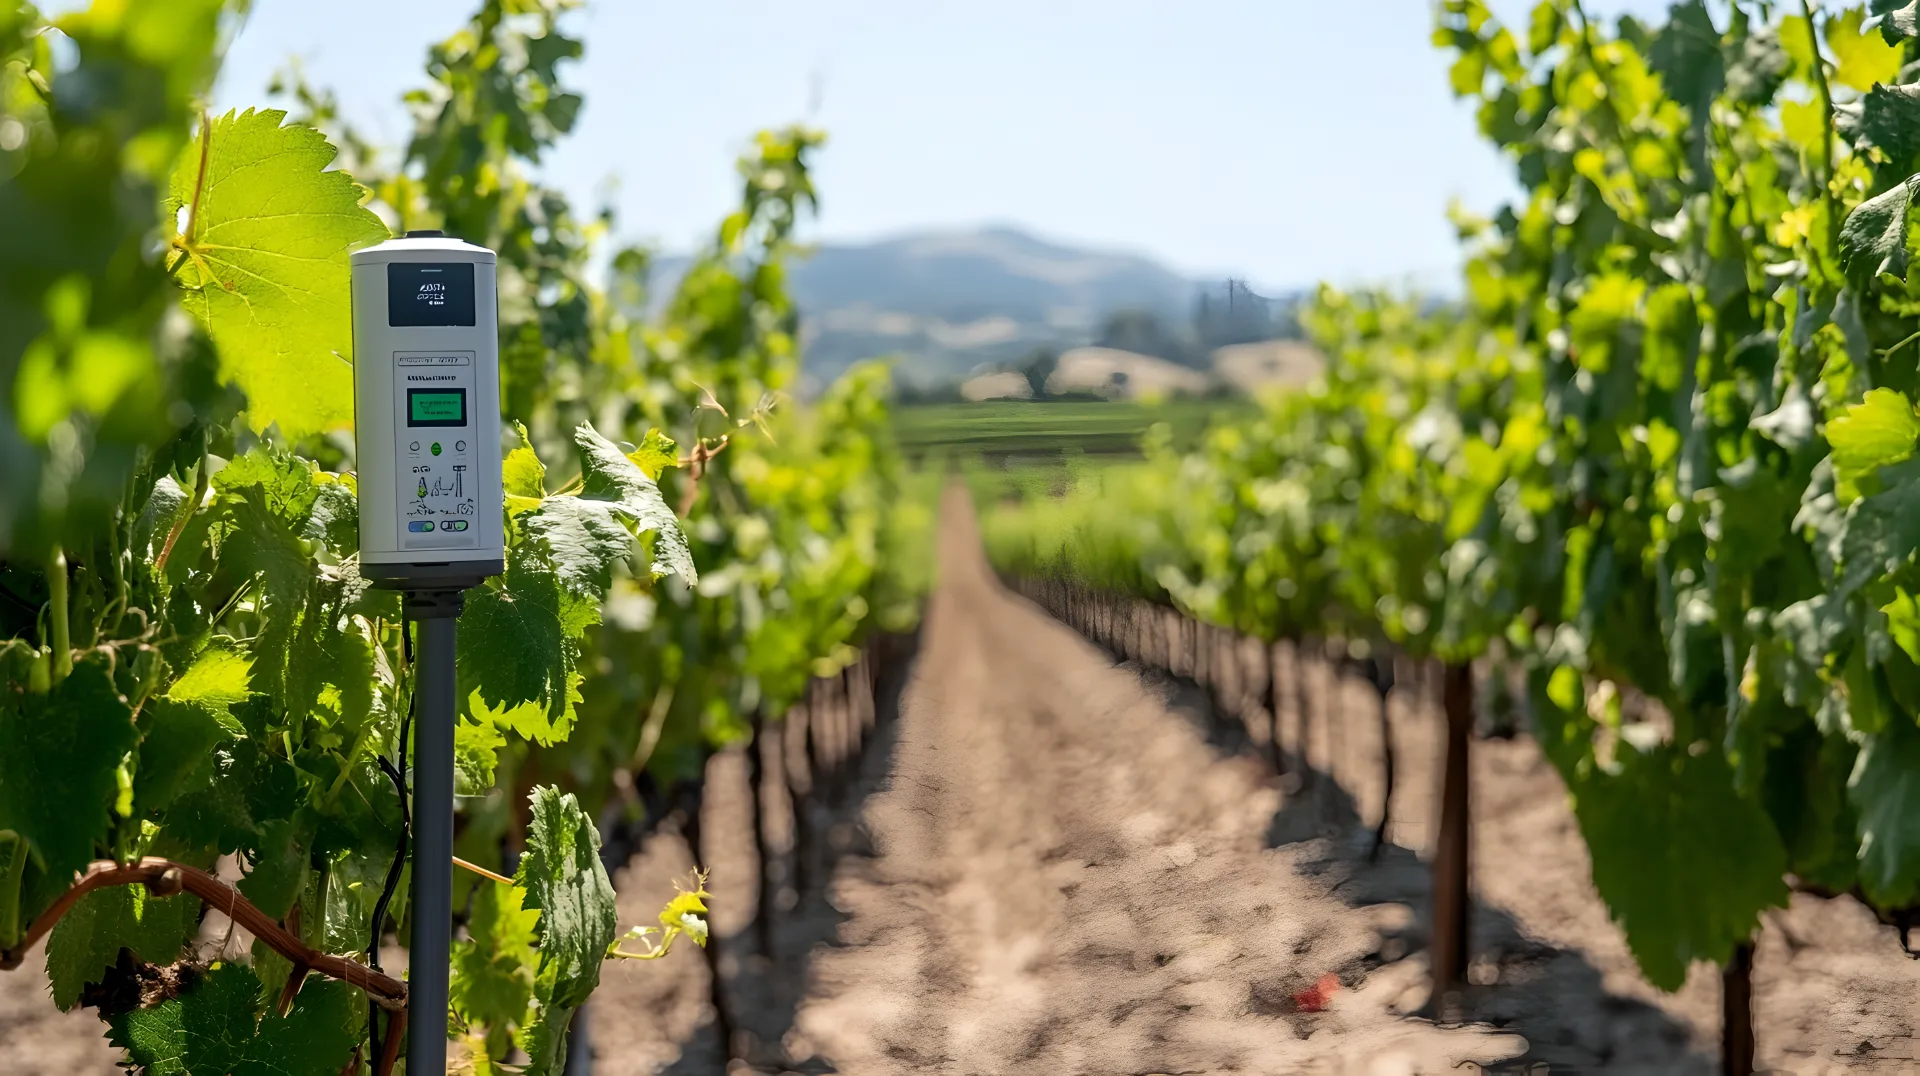
The root cause is rarely technical capacity. It’s design. Devices are commonly configured to report on a fixed interval regardless of whether anything decision-relevant has changed, so volume outpaces anyone’s intention to review it. That data then lands in a device vendor’s proprietary cloud, a connectivity console, or a spreadsheet, with no common path into the systems where decisions get made. Even when it lands somewhere sensible, it often arrives without context: a temperature reading means little without knowing which asset, which location, and which threshold matters. And most pipelines stop at a dashboard, with the data being treated as the deliverable, rather than a step toward a decision or an automated response. Ownership of “what happens next” falls between IT, operations, and the business unit that requested the sensor, and falls through the cracks because no single team owns that last mile.
What Putting Data to Work Actually Looks Like
The organizations that get this right share a pattern: they stop asking someone to watch a graph and start asking the system to watch it for them – and speak up when something warrants attention. They aggregate across the fleet rather than staring at individual devices, because a single sensor reading is rarely strategic – a trend across five hundred devices, by region or asset type, is. They treat data handling as part of the connectivity layer itself, not a separate data science initiative that requires a new team, a new budget line, and a six-month timeline before anyone sees value.
- Healthcare: billing data becomes a clinical early-warning system. CPAP machines upload nightly usage data because Medicare requires it — at least four hours of use on 70% of nights within a 90-day window, a standard many private insurers have since adopted (CPAP Clarity). That data was built to answer one question, then aged out. But research puts 90-day non-adherence as high as half of patients in some studies (ScienceDirect), and the warning signs (shrinking session lengths, growing gaps between uses, rising mask-leak rates) were already sitting in the billing stream. Providers modeling against that existing data can flag at-risk patients within weeks instead of at the 90-day check, when the intervention window has already closed.
- Public safety: transit video that answers a question instead of just recording one. Onboard transit cameras generate video volumes no one watches until an incident forces a search for it. An event-driven model flips that order: a panic-button press, sudden deceleration, or geofence breach triggers an on-demand pull from that vehicle’s stream, putting the right camera in front of a responder in the moment it matters – not an archive to search afterward. The event decides what deserves attention, not a person watching a hundred feeds.
- Industrial: compliance logs reveal years of invisible underperformance. Wind turbines log SCADA data every ten minutes largely because grid operators and regulators require it. Chronic yaw misalignment — a turbine pointed a few degrees off the wind — never trips an alarm, but can cost an estimated 1–3% of annual energy production depending on the angle (MDPI). In one case, analytics firm Bitbloom identified a yaw issue that neither the operator nor its service provider had flagged, using nothing but Cubico Sustainable Investments’ existing SCADA data — the recovered energy alone covered a year of monitoring cost across Cubico’s European wind portfolio (Bitbloom). No new sensors, no new collection — the signal was already on disk.
In each case, nothing new was collected. The data already existed; someone just built a reason to read it. That’s a cheaper, faster starting point than any new sensor deployment.

Closing the Gap, End to End
This is where the architecture of the connectivity platform matters as much as the devices themselves. Data collection, routing, visualization, analysis, and action need to function as one pipeline rather than five disconnected purchases.
Soracom Harvest handles collection directly from Soracom Air-connected devices, indexing and visualizing data with no separate infrastructure to stand up – value starts at the first byte, not after a data engineering project. From there, data doesn’t have to dead-end in a silo: Soracom Beam, Funnel, and Funk, reachable through a single unified endpoint, can route the same data to a custom API, directly into cloud services like AWS Kinesis or Azure Event Hubs, or into a serverless function, without reconfiguring the device.
Soracom Lagoon turns stored data into dashboards and threshold-based alerts without separate BI tooling. Soracom Query lets non-technical users query accumulated device and connectivity data in natural language instead of SQL. And Soracom Flux closes the loop with low-code automation (I.e. a Slack alert, AI image analysis, a webhook), so an anomaly doesn’t just get seen, it gets acted on.
A Composite Example
Picture a distributed fleet of remote refrigeration units, sending temperature and door-status data every few minutes. Left alone, that’s classic dark data – reviewed only after a spoilage complaint. Routed through an automated threshold alert instead, the same data flags a unit trending warm hours before product loss, and triggers a maintenance ticket without anyone opening a dashboard first. Same sensors, same data volume. The only difference is whether the pipeline was built to notice.
The Metric That Actually Matters
Most IoT strategy still measures success by data volume collected: SIMs deployed, records stored, terabytes retained. A more useful question is what percentage of that data ever reaches a decision. That’s a harder number to produce, and a far more honest one. Before adding another sensor, it’s worth auditing what the ones you already have are telling you – and whether anyone, or anything, is listening.
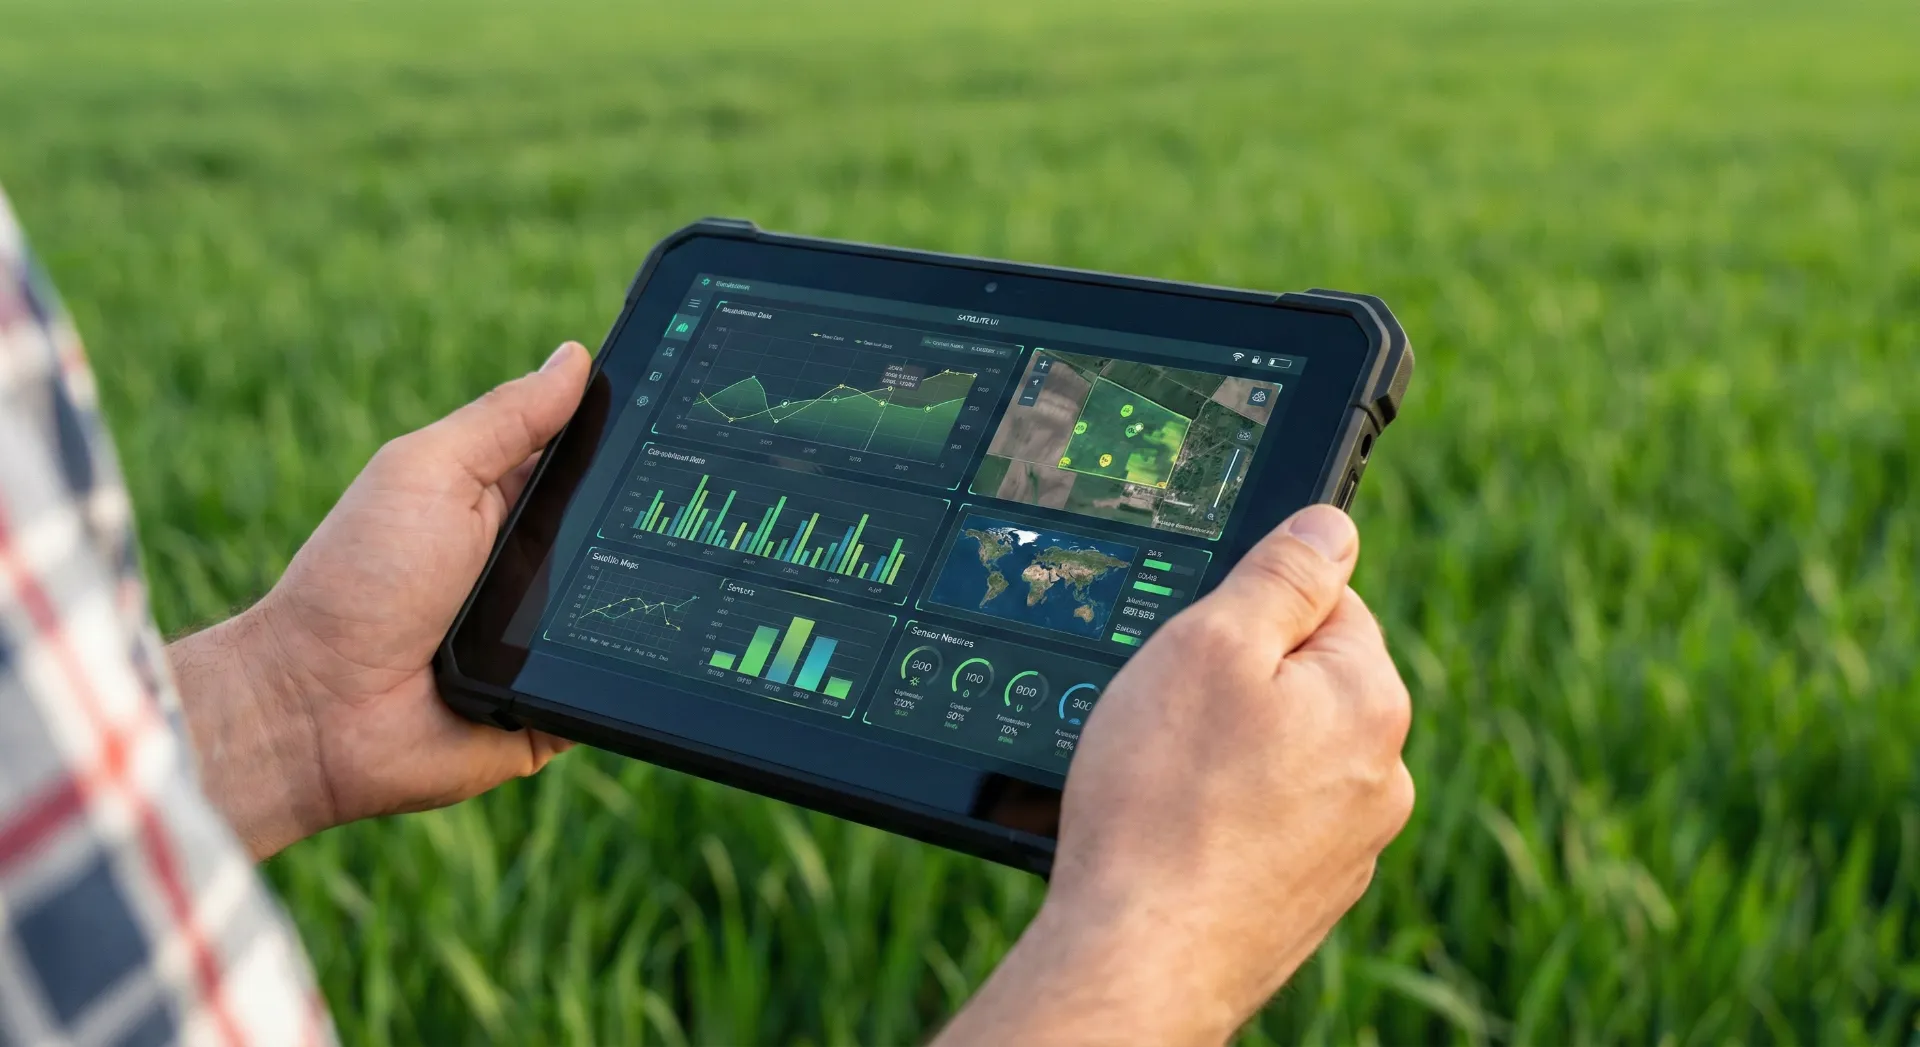
Looking to get the most from your data? From dashboards that provide essential insight, to virtual private gateways that secure your information, Soracom can help get a handle on your data needs. Reach out today to discuss!


MORE LIKE THIS



What is Soracom?
Discover why technology innovators choose Soracom for connecting their
devices to the cloud over cellular.

Soracom's Picks
Advices and interviews, to inform and inspire.


The API-First Connectivity Model: Why Managing Your SIM Cards Should Feel as Easy as Managing Your AWS Instances
TL;DR Ask a technology leader how long it takes to…

Your Fleet Data Inside Your Team’s AI Tools: the Soracom Query Connector for Claude and ChatGPT
TL:DR I have spoken before about how Soracom Query can…

The Anatomy of a Secure Connection: Why VPNs Are So 2015, and How Private Networking Protocols Are Taking Over
TL;DR Every technology has a decade it belongs to. Much…


Cloud Native
IoT Connectivity Platform
Soracom built the worlds first cloud-native connectivity management platform, built on AWS. Learn more about going beyond connectivity.