Use automation and insight to stay ahead of fleet issues
|
Automate responses to device and network events
Monitor fleet health and performance at a glance
Apply analytics and AI without rebuilding your stack |

Automation & Fleet Intelligence
Keep your device fleet observable, responsive, and easier to manage
Use event-driven workflows, dashboards, and analytics to monitor your fleet, trigger responses, and surface insights—without standing up custom infrastructure or writing backend code.
Move from watching your fleet to actively managing it
As connected fleets grow, it becomes impossible to manually track every device, metric, and alert. Device Fleet Monitoring & Automation features help teams define event-driven rules, monitor fleet health, build dashboards, and analyze behavior—so the system can tell you what needs attention instead of the other way around.
Whether you’re monitoring sensors, meters, cameras, vehicles, or machines, these capabilities help you respond faster, reduce manual checks, and uncover patterns that improve long-term reliability.
From alerts and workflows to dashboards and AI assistants
Automate repetitive tasks and use data to guide operational decisions

Turn device and connectivity events into automated workflows
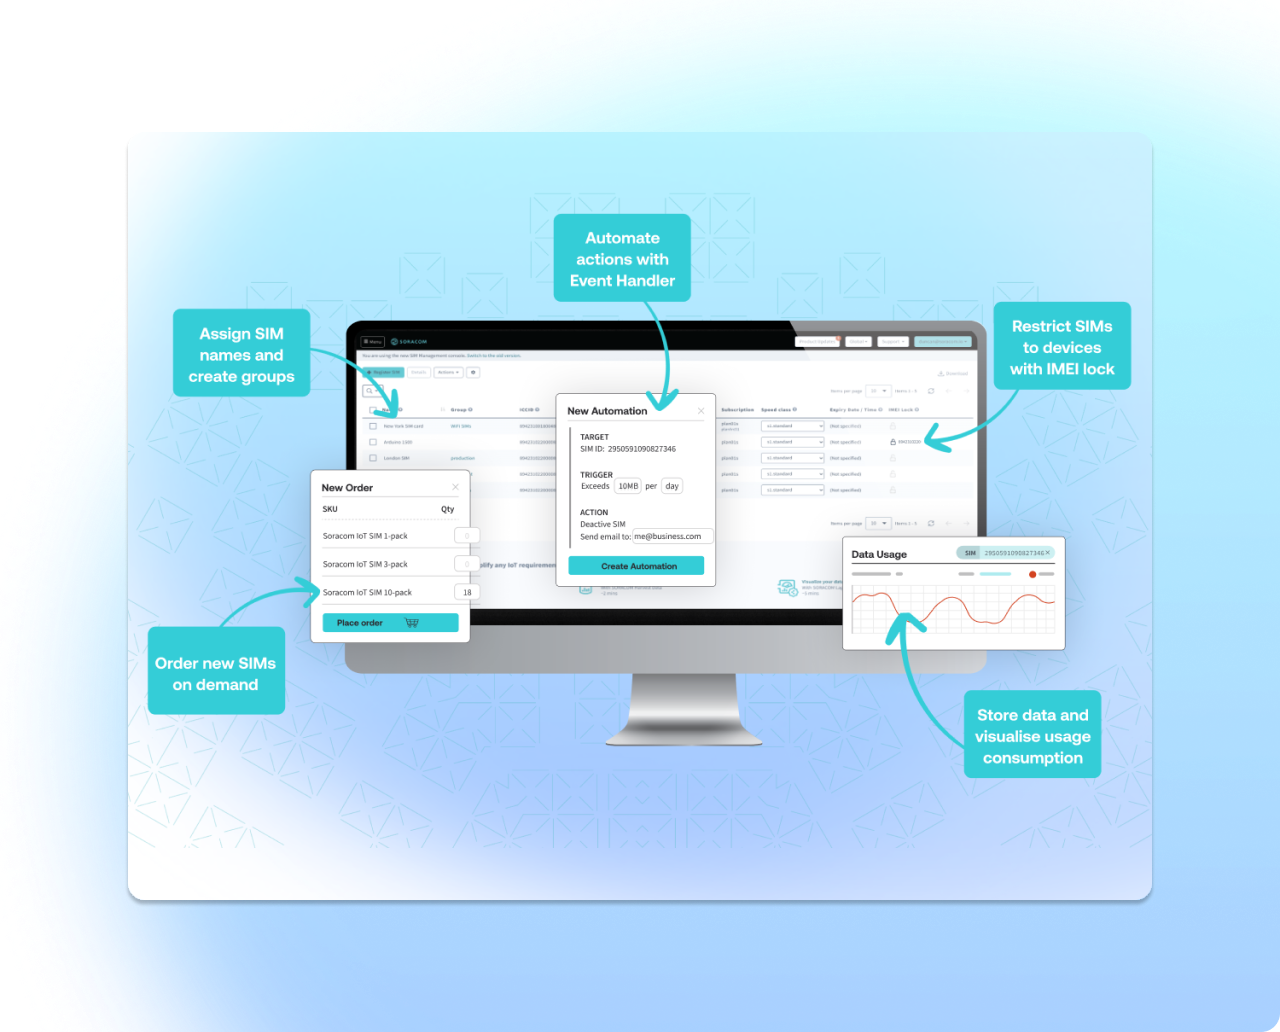
You can define rules that watch for device metrics, connectivity changes, SIM usage, or payload values and then trigger actions such as notifications, webhooks, or cloud functions. This lets teams codify standard operating procedures directly into the platform instead of maintaining custom scripts scattered across environments. (Event-driven automation — Soracom Event Handler)
Example:
If a commercially deployed water level sensor crosses a data-use threshold or continues to show anomalous drop offs, the system can notify operations via email or Slack, log the event, and invoke a cloud function to open a ticket—automatically.
-
Trigger actions from device or SIM events
-
Notify people or systems via email, Slack, webhooks, or cloud functions
-
Centralize automation instead of maintaining scripts

Visualize fleet behavior with shareable dashboards
Build dashboards that surface key metrics across your fleet—such as signal quality, usage trends, sensor data, or alert counts—without running your own visualization stack. Share read-only views so teams can align around the same information. (IoT dashboards — Soracom Lagoon built on top of Harvest)
Example:
A facilities team can view temperature trends, connectivity status, and alert history for all buildings in one dashboard, then share a read-only version with management.
-
Create dashboards from collected device data
-
Combine charts, maps, tables, and alerts
-
Share read-only views with stakeholders
What teams normally struggle with
|
Manual monitoring and ad-hoc alerts
Fragmented view of device and connectivity health
Underused data
Custom automation that’s hard to maintain |
Monitor sensor data, data usage, and
connectivity status of deployed devices
Create dashboards for fleet-wide visibility with visualization tools

Build dashboards showing key metrics across your fleet—sensor values, locations, usage trends—without running your own visualization stack.
-
Combine charts, maps, and tables
-
Share dashboards with read-only viewers
-
Configure alerting on key metrics
Learn More: Fleet dashboards (Soracom Lagoon + Harvest)
Lookup connectivity and usage analytics in near realtime

Analyze connectivity quality, usage patterns, and SIM behavior to spot anomalies, optimize plans, or diagnose issues.
-
Explore historical usage
-
Identify outliers or misbehaving devices
-
Support capacity planning and optimization
Learn More: Connectivity analytics (Soracom Query)
Use automation and AI to scale operational decision-making
Ask natural-language questions about your fleet and connectivity data
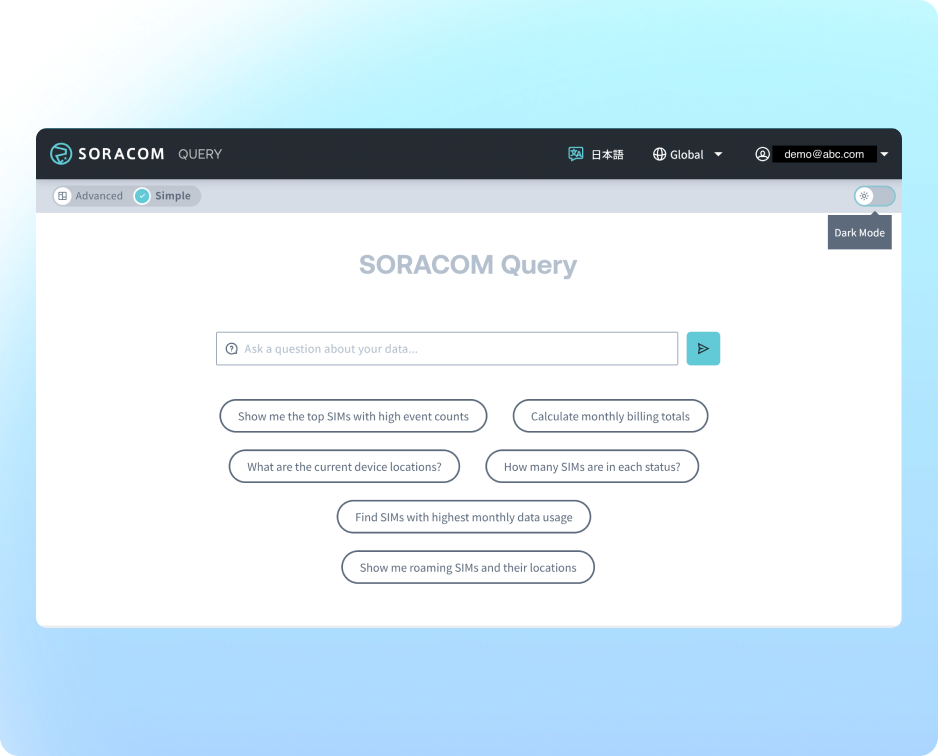
Query IoT and connectivity data using natural language, then turn results into charts, reports, or investigations. This gives teams fast answers about behavior, cost, and performance without writing SQL. (AI-powered data analysis — Soracom Query, MCP Server)
Example:
Operations can ask, “Which devices had the most connection failures in the last 7 days?” and instantly get a chart and list of affected SIMs.
-
Natural-language queries over IoT and connectivity data
-
Visual outputs for trends and comparisons
-
Support troubleshooting and reporting
Automate application-level workflows without custom infrastructure
Low-code workflows for IoT operations
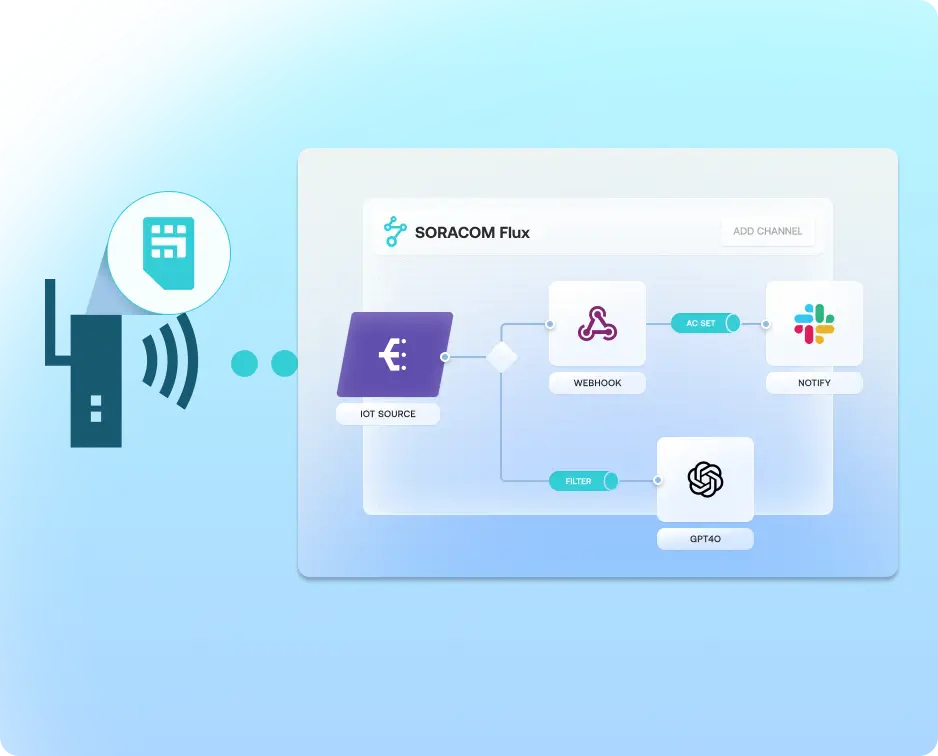
Design workflows that connect event sources, channels, and actions to automate monitoring, anomaly detection, and notifications—without building your own application backend.
-
Low-code configuration
-
Integrate sensors, cameras, and external services
-
Trigger webhooks, emails, or device commands
Learn More: Low-code IoT applications (Soracom Flux)
Enable AI assistants for fleet operations

Expose device and connectivity data to AI agents in a controlled way so they can answer questions, generate summaries, or trigger workflows.
-
A secure data access layer for AI
-
Combine device, connectivity, and application state
-
Support operational copilots and assistants
Learn More: AI-integrated data access (Soracom MCP Server)
Additional tools that support device fleet monitoring and automation

Collect device data for automation and dashboards without new infrastructure
Ingest and store device telemetry directly in the platform to power dashboards, alerts, and workflows without provisioning databases or brokers. (Device data collection — Soracom Harvest)
-
Serverless data ingestion
-
Simple handling of time-series and GPS data
-
Provides the foundation for dashboards and rules

Get a demo of our fleet automation and analytics features
Discuss how to design alerting, dashboards, analytics, or AI-assisted workflows around your fleet with a Soracom specialist.
Frequently Asked Questions
How do I set up rules that react to device or SIM events?
You can define event-driven rules that respond to device data, connectivity changes, SIM usage, or metadata and trigger notifications, webhooks, or cloud functions. (Event-driven automation — Soracom Event Handler)
How can I visualize fleet health and performance?
You can build dashboards that show sensor readings, connection status, and usage trends using built-in tools. (Lagoon + Harvest)
How do I analyze connectivity issues or unusual SIM behavior?
Connectivity data can be queried and visualized to identify patterns such as repeated session drops, abnormal usage, or coverage issues. (Soracom Query)
Can I send data to multiple cloud services at once?
Yes. Low-code tools let you connect events, channels, and actions to automate monitoring, notifications, and interactions. (Soracom Flux)
Can I start small and expand automation later?
Absolutely. You can begin with simple rules or dashboards and grow into advanced workflows, analytics, and AI-driven operations as your fleet expands.
Do I need to build my own alerting or rules engine?
No. The platform watches for thresholds, state changes, and anomalies, and executes predefined actions without custom infrastructure.
Can non-technical stakeholders access dashboards?
Yes. Dashboards can be shared in read-only mode so teams like operations or management can view the same information without having portal access.
Can I use AI or natural language to explore my fleet data?
Yes. Natural-language interfaces let you ask questions about IoT and connectivity data without writing queries. (Soracom Query, MCP Server)
How does automation work with my existing cloud systems?
Automations can call webhooks, invoke cloud functions, or trigger actions inside your cloud event pipeline, fitting cleanly into your architecture.