What you’d build without Soracom Query
|
Export CSVs and manage your own analytics stack
Build and operate a dedicated BI pipeline
Rely on internal experts for every deep-dive |

Reporting Service
Soracom Query
Natural-Language IoT Data Analytics
AI-Powered IoT data analytics using natural-language processing
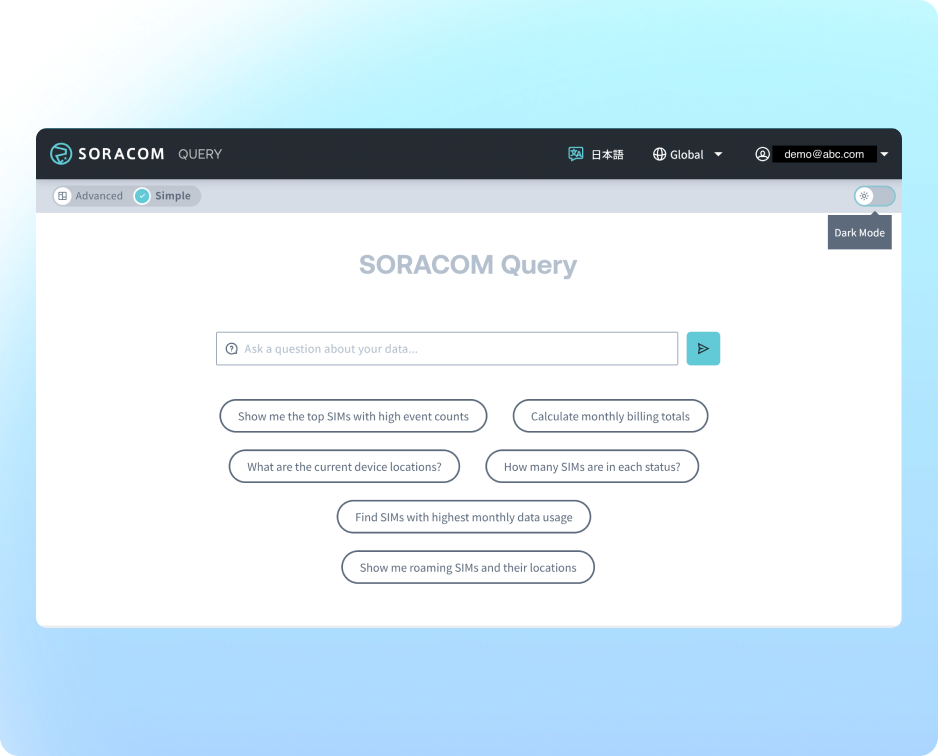
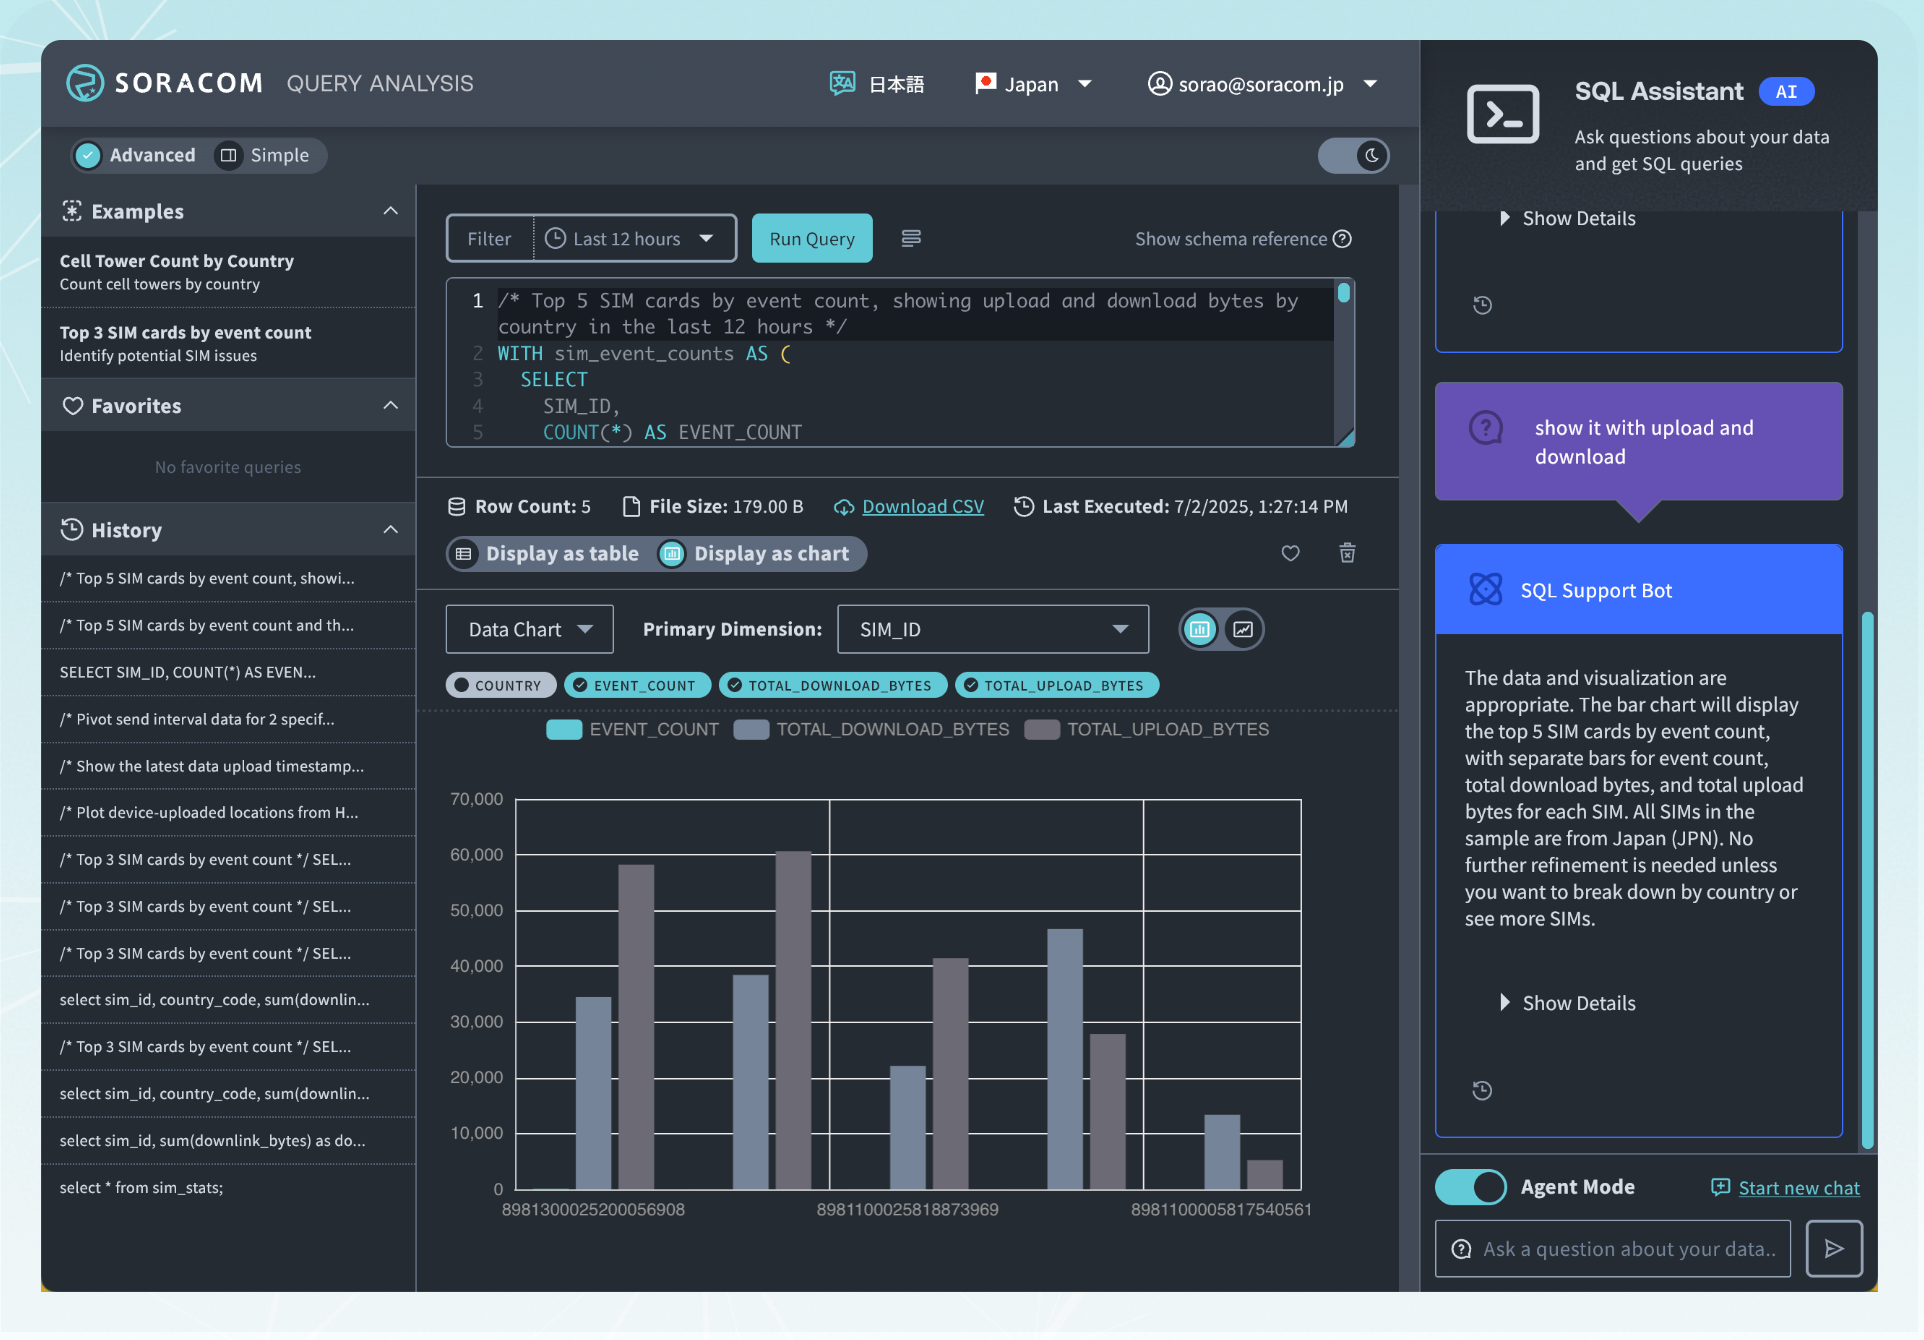
Soracom Query turns your connectivity and device data into an interactive analytics workspace. You can ask questions in natural language or use SQL-style queries to investigate SIM behavior, data usage, billing, and sensor trends—without exports, custom scripts, or manual spreadsheets.
Understand what’s happening with your SIMs, devices, and data across the entire fleet
Soracom Query analyzes session history, connectivity metadata, billing records, and optional device data from Harvest to answer complex questions with a single request, such as:
- > SIMs that switched carriers more than 5 times in the last 30 days
- > Top 10 data users this month
- > Devices that haven’t connected in 24 hours
Query will generate the underlying SQL, run it against a Snowflake data warehouse, and present aggregated results—often with suggested visualizations like tables, charts, or maps.
You get BI-grade insight without maintaining your own warehouse, ETL, or reporting tools.
Why add Soracom Query to your deployment?
Turn data into answers
Replace manual exports and spreadsheets with direct, queryable access to SIM and device data.
Lower analytics barrier
Let non-technical teams ask natural language questions instead of writing complex SQL.
Operate proactively
Detect anomalies, unstable connections, and runaway usage before they impact customers.
How it works
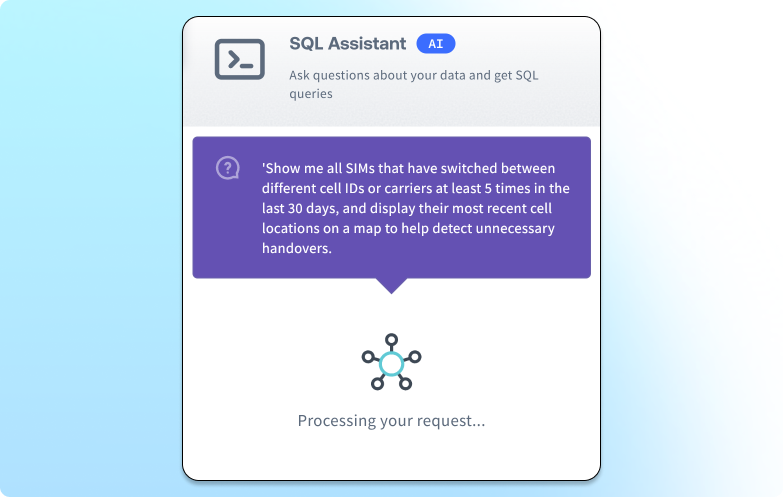
Ask natural language questions about your fleet
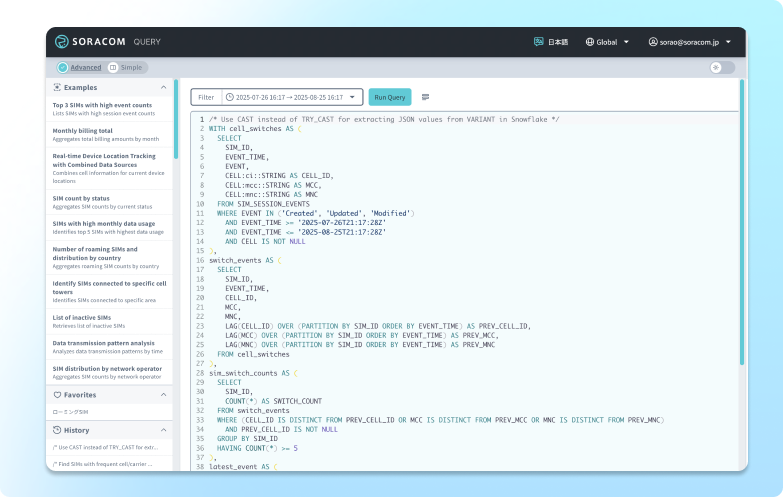
Type questions like “Show me SIMs with the highest data usage this month” or “List devices that haven’t created a session in 7 days,” and Soracom Query’s AI SQL Assistant translates them into Snowflake-ready SQL. It validates expressions, fixes errors, and retries automatically so you don’t need to be a database expert to get reliable results.
Analyze connectivity, billing, and device data in one place
Query brings together multiple data domains: session history and connectivity details, billing and plan information, and optional Harvest Data/Files from your devices. You can correlate signal stability with data usage, find SIMs with abnormal event counts, or track devices by country, carrier, or cell ID from a single interface.
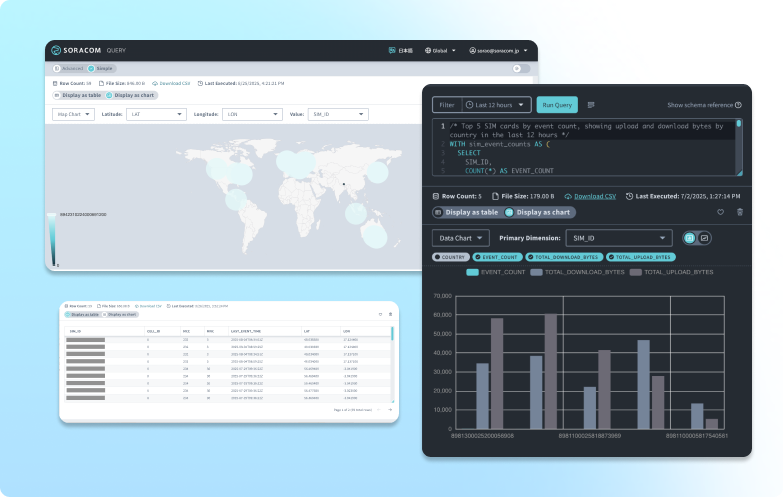
Get built-in visualizations and exportable results
Based on your query, Soracom Query can automatically choose or suggest visualizations—time series, bar charts, or maps for location-based data—or you can request specific views. Results can be downloaded as CSV or connected to BI tools like Tableau and Looker Studio using a read-only Snowflake account.
Key takeways for the advantages of using Query
Increase operational efficiency
Cut manual reporting and ad-hoc analysis from hours to seconds across support, ops, and engineering.
Control cost and avoid surprises
Detect runaway sessions, misconfigured devices, and abnormal usage before they show up on invoices.
Improve fleet reliability
Use connectivity and session data to spot unstable coverage, “ping-ponging” connections, or offline devices early.
Architecture and implementation
Soracom Query runs on top of Soracom’s existing connectivity data infrastructure. Connectivity, billing, and optional sensor data are continuously ingested into a Snowflake data warehouse. When you ask a question—using natural language or SQL—the AI SQL Assistant translates your intent into a safe, optimized query, executes it in Snowflake, and returns results with suggested visualizations. Enterprise users can also access the same warehouse via a read-only Snowflake account to integrate with external BI tools.


Step 1
Access Soracom Query and select the dataset you want to analyze
Open the Soracom User Console and navigate to the Soracom Query section.
Choose the dataset you want to analyze—such as session history, SIM activity, billing records, or connectivity metadata—depending on your operational or diagnostic needs.
Query provides direct access to historical and near-real-time Soracom platform data without exporting CSVs or contacting support.
Learn more about available datasets in the Soracom Query documentation.

Step 2
Run queries using filters, conditions, or natural language prompts
Use the Query interface to build your request by applying filters such as SIM ID, time range, carrier, location, traffic volume, or session status.
Depending on your plan, you can also use natural language queries to ask questions like “which SIMs have the highest session failures today?” or “show devices switching between carriers frequently.”
Soracom Query translates your request into optimized lookups against Soracom’s analytics backend, returning structured results quickly and consistently.
Explore query patterns in the Query usage guide.

Step 3
Review query results and use insights to debug or optimize your deployment
View the returned dataset directly in the console to analyze connectivity trends, identify unstable SIMs, diagnose session issues, or monitor regional carrier performance.
Export data for reporting, integrate results into BI tools when using Snowflake access, or pair Query with Flux to trigger automated alerts based on analytical thresholds.
Soracom Query gives teams operational visibility without custom tooling, making it easier to maintain and scale deployments.
Learn more about working with output formats in the Query results guide.
How Soracom Query works with other Soracom services
|
Use Query + Harvest to analyze sensor trends
Use Query + Lagoon for advanced dashboards
Use Query + Flux for automation and alerts
Use Query + Event Handler for follow-up actions |

Put your IoT data to work with Soracom Query
Create a free Soracom Operator ID and start exploring SIM, connectivity, and device data with natural language and SQL-style queries—no extra BI infrastructure required.


Frequently Asked Questions
What is Soracom Query?
Soracom Query is a reporting and analytics service that lets you investigate SIM, connectivity, billing, and device data using natural language or SQL-style queries powered by a Snowflake data warehouse.
What kinds of data can I analyze with Query?
You can analyze billing history, session and connectivity details (country, carrier, cell tower, usage), and device data stored in Harvest Data or Harvest Files.
Can I integrate Soracom Query with Tableau or Looker Studio?
Yes. Enterprise users receive a read-only Snowflake account that lets them connect popular BI tools like Tableau, Looker Studio, and others to the same underlying data.
How is usage billed?
Soracom Query is available under the Business Plan with a usage-based pricing model, typically starting with a monthly query allowance (e.g., 2,000 queries) and options for higher tiers or custom enterprise pricing.
Do I need Soracom Air or Harvest to benefit from Query?
Query can work with multiple data sources, but the most valuable insights come when you’re actively using Soracom services like Air, Harvest, and associated connectivity features.
Do I need to know SQL to use Soracom Query?
No. You can start with natural language questions, and the built-in AI SQL Assistant will generate and correct SQL for you. Users who know SQL can refine and customize queries as needed.
How is Soracom Query different from using my own BI tool?
Query runs directly on Soracom’s managed Snowflake warehouse with your connectivity data already modeled and available. You don’t need to build ETL jobs, maintain schemas, or manage a separate analytics stack—though you can still connect external BI tools if you want.
Is Soracom Query real-time?
Query is designed for near-real-time operational insight. Connectivity and usage data are ingested continuously so you can investigate recent behavior and historical trends in the same place.
How does Soracom prevent misuse or runaway queries?
Query includes safeguards such as limits on execution time, time range, and result size, along with usage-based billing, to encourage efficient, responsible use.