How Soracom Lagoon works with other Soracom services
|
Use Lagoon + Harvest for instant dashboards
Use Lagoon + Inventory for fleet insights
Use Lagoon + Funnel/Beam/Funk for cloud extensibility |
Reporting Service
Soracom Lagoon
Dashboard and visualization service that turns device data into real-time, shareable insights without building your own reporting tools.
Visualize device data and share insights instantly without building custom dashboards
Soracom Lagoon provides real-time dashboards, alerts, and visualizations for data stored in Soracom Harvest or streamed from your devices. It lets teams analyze trends, share views with stakeholders, and monitor fleet health through a friendly, customizable interface—no custom tooling required.
Create dashboards your team can understand, use, and trust
With Lagoon, you can build charts, maps, time-series graphs, and threshold-based alerts using the same data your devices already send to Harvest. Create dashboards for engineering, operations, or customers, and securely share them through links or role-based access. Lagoon gives non-technical and technical teams a fast way to turn raw IoT data into meaningful, actionable insight.

Why use Soracom Lagoon for your project?
Real-time visibility
Understand device behavior instantly with streaming dashboards.

Actionable alerts
Notify teams when devices exceed thresholds or require attention.

Share insights easily
Give customers and teams access to dashboards without building your own UI.
How it works
Build dashboards with no code
Create time-series graphs, maps, tables, KPIs, and composite visualizations using a drag-and-drop interface. Lagoon updates dashboards automatically as new device data arrives.
Set alerts and notify teams instantly
Define threshold alerts for values like temperature, battery level, signal quality, or sensor readings. Notify teams via email, Slack, or webhook to take action in real time.
Share reports with customers or internal teams
Use role-based access or public-link sharing to expose dashboards to partners, operations teams, or end users. Lagoon lets you publish visual insights without revealing your full Soracom console.
Architecture and implementation
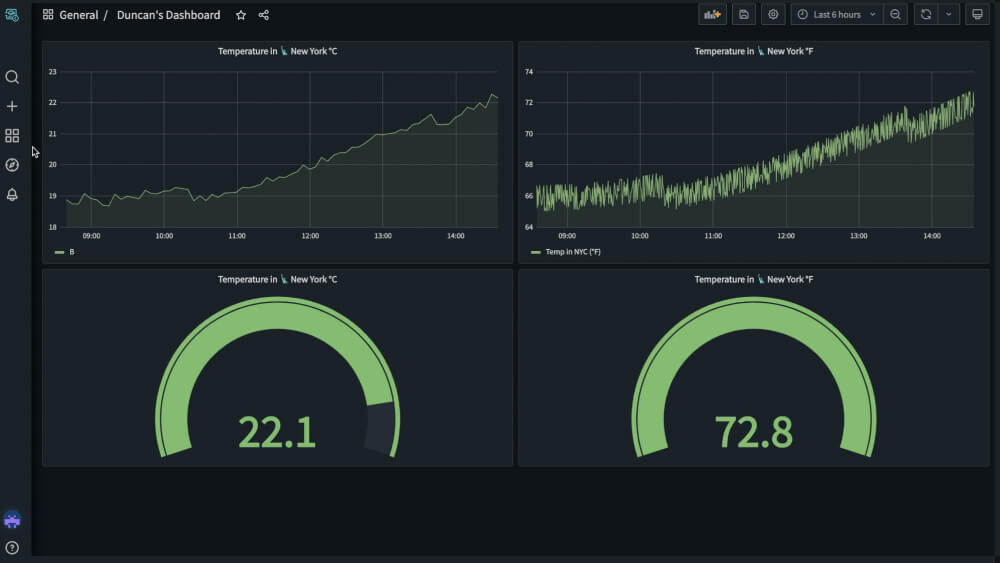
Lagoon pulls data directly from Soracom Harvest or your connected backends and renders it through an intuitive Grafana-based dashboard environment. Users can explore datasets, configure visualizations, define alerts, and publish read-only dashboards for external stakeholders. Lagoon reduces the need for custom visualization software, managing user access, or building dedicated monitoring tools.


Step 1
Enable Soracom Lagoon and connect it to your data sources
Start by opening the Soracom User Console and navigating to the Lagoon section.
Create a new Lagoon workspace and connect it to your existing Soracom data sources such as Harvest Data, Harvest Files, or external MQTT/HTTP streams.
Lagoon automatically reads your device telemetry and prepares it for dashboards, alerts, and shared visualizations—no ETL or database setup required.
Setup instructions are available in the Soracom Lagoon documentation.

Step 2
Build dashboards and visualizations using Lagoon’s drag-and-drop tools
Use Lagoon’s visual dashboard builder to create charts, gauges, maps, and tables using your device data.
Simply drag widgets onto the canvas, select a data source, and configure time ranges, labels, thresholds, and display styles.
No coding or query language is required—Lagoon handles time-series queries behind the scenes, making it easy for teams to explore and understand operational data.
For dashboard options and widget details, visit the Dashboard creation guide.

Step 3
Share dashboards and set alerts for real-time monitoring
Publish dashboards to share with colleagues or customers, using Lagoon’s built-in access controls to manage who can view or edit each workspace.
Set up alert rules to notify your team by email, Slack, or webhook when device data exceeds thresholds or shows abnormal patterns.
Lagoon makes it easy to operationalize insights without maintaining your own monitoring stack.
Learn more about sharing and alerting in the alerts and notifications guide.
How Soracom Lagoon works with other Soracom services
|
Use Lagoon + Harvest for instant dashboards
Use Lagoon + Inventory for fleet insights
Use Lagoon + Funnel/Beam/Funk for cloud extensibility |

Turn device data into insights with Soracom Lagoon
Create a free Soracom Operator ID and start building dashboards and alerts using your live IoT telemetry.
Frequently Asked Questions
What is Soracom Lagoon?
Lagoon is a dashboarding and visualization service built on Grafana that displays IoT data in real time.
Can I share dashboards with customers?
Yes. You can publish read-only dashboards or assign role-based access.
Can I combine multiple device groups into a single dashboard?
Absolutely. Lagoon makes it easy to visualize mixed datasets in one view.
Does Lagoon require coding?
No. Everything—from dashboards to alerts—is created through an intuitive interface.
Do I need my own database to use Lagoon?
No. Lagoon works directly with data stored in Soracom Harvest or other Soracom-connected sources.
Does Lagoon support alerts?
Yes. Alerts can notify users via email, Slack, or webhook.
How often do dashboards update?
Dashboards update in real time as data arrives.