
How to Monitor Cellular Connections
In IoT system monitoring, it’s essential to keep an eye on a device’s system resources and, battery levels to ensure that the entire deployment keeps functioning correctly. Because of the sheer number of devices involved in many IoT applications, systems administrators must rely upon specialized techniques to effectively manage their deployments. Additionally, the increasing variety of effective and affordable communication technologies becoming available for IoT, means the use of wireless communication – particularly cellular connections—has been on the rise. This has introduced new considerations for monitoring these systems.
While there’s plenty to discuss about leveraging cellular connections in IoT, comprehensive information on which aspects of cellular connections should be monitored is surprisingly scarce.
Monitoring Cellular Connections
Between technological advancements, improved coverage, and increased support, Mobile Network Operators (MNOs) have greatly reduced connectivity issues experienced by the average mobile phone user over the past several years.
When it comes to IoT devices, however, factors such as the installation location can mean that communication won’t always perform as expected. Even in environments where connectivity seems fine during the testing stage, operational issues such as intermittent or unstable communication may arise once the system is fully deployed. This can be true for devices in motion as well as fixed-location installations, suggesting that all deployments are vulnerable to periods of instability.
These instabilities can stem from a variety of factors, including the placement and output of nearby base stations, interference from non-cellular wireless signals, or even weather conditions. Unlike Wi-Fi, cellular connections share resources with untold numbers of other devices in an area, making them susceptible to the usage conditions of nearby devices. For mobile applications, communication quality can also shift as the device moves between different network areas. Fixed-location devices, meanwhile, can experience quality drops at certain times of the day should obstacles temporarily block the device. This can include obstructions as simple as storm shutters or doors, or even vehicles moving into innopportune positions.
Other contributing factors include the characteristics and design of a device’s antenna or modem, or even occasional hardware or firmware faults. Beyond wireless connectivity challenges, instability can also arise at the IP layer, with issues like route changes or packet loss.
Although IoT system operators often have limited control over many of these causes, external factors can still lead to fluctuations or, in extreme cases, interruptions in connectivity during the operational phase. Recognizing this, it becomes essential to design system monitoring solutions with these potential variances and disruptions in mind.
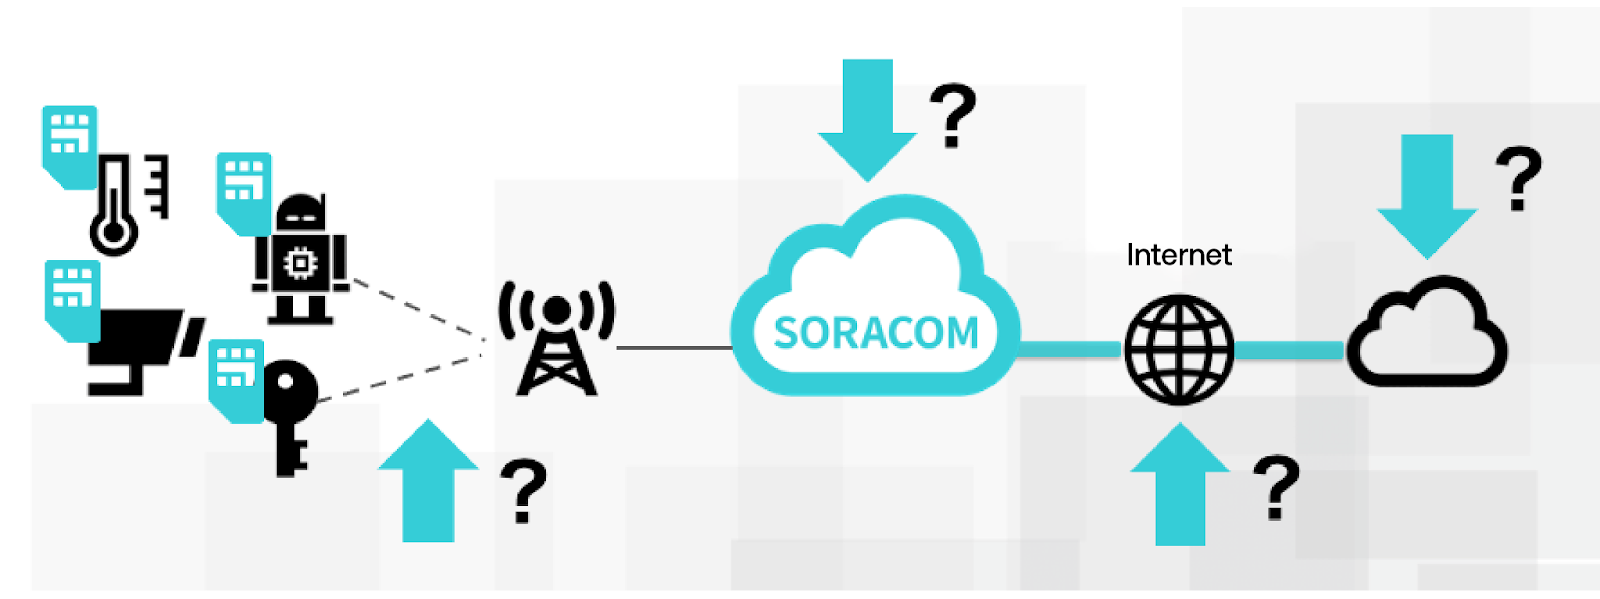
Let’s explore the metrics you’ll want to monitor at the wireless and IP layers in IoT systems, and consider methodologies for regularly collecting system status data. Keeping these metrics and processes organized will make it easier to isolate and troubleshoot issues if and when they arise.
Monitoring the IP Layer
At the IP layer, it’s best practice to measure metrics like round-trip time (RTT) and packet loss on a hop-by-hop basis, similar to network or server monitoring. For Linux-based devices, you can periodically execute the mtr command and collect the results for analysis.
Some telecommunications providers offer dedicated endpoints for ping responses within their network. For example, Soracom provides pong.soracom.io as a suitable endpoint for such measurements. Monitoring this endpoint allows you to assess the communication quality between the device and the cellular network, thereby isolating fluctuations originating beyond the cellular network and into external networks.
By regularly collecting and storing this data, you can efficiently pinpoint and address issues affecting communication performance or quality when problems arise.
Example of Executing the mtr Command
<code>``` </code>
<code>pi@raspberrypi:~ $ mtr -r 1.1.1.1</code>
<code>Start: 2021-12-23T02:46:04+0000 </code>
<code>HOST: raspberrypi                 Loss%   Snt   Last   Avg  Best  Wrst StDev   </code>
<code>1.|-- ec2-54-150-128-69.ap-nort  0.0%    10  123.4 148.1 116.9 229.9  38.8   </code>
<code>2.|-- ???                       100.0    10    0.0   0.0   0.0   0.0   0.0   </code>
<code>3.|-- ???                       100.0    10    0.0   0.0   0.0   0.0   0.0   </code>
<code>4.|-- ???                       100.0    10    0.0   0.0   0.0   0.0   0.0   </code>
<code>5.|-- ???                       100.0    10    0.0   0.0   0.0   0.0   0.0   </code>
<code>6.|-- ???                       100.0    10    0.0   0.0   0.0   0.0   0.0   </code>
<code>7.|-- 100.65.12.225              0.0%    10  127.6 118.9 109.3 132.2   7.5   </code>
<code>8.|-- 15.230.154.114             0.0%    10  112.8 120.7 109.1 129.3   6.8   </code>
<code>9.|-- 15.230.129.144             0.0%    10  126.3 124.6 108.9 132.4   6.8  </code>
<code>10.|-- 15.230.160.40              0.0%    10  128.6 122.8 108.9 133.1   9.3  </code>
<code>11.|-- 100.91.149.148             0.0%    10  127.9 122.6 109.6 141.5  11.0  </code>
<code>12.|-- 150.222.244.38             0.0%    10  122.3 122.3 111.4 132.8   7.7  </code>
<code>13.|-- 100.91.147.23              0.0%    10  115.6 122.7 110.2 130.8   6.6  </code>
<code>14.|-- 52.95.30.69                0.0%    10  121.0 127.6 111.1 139.6  10.0  </code>
<code>15.|-- 52.93.251.252              0.0%    10  125.3 122.7 110.8 140.9  10.0  </code>
<code>16.|-- 99.83.91.91                0.0%    10  128.6 122.4 109.6 136.8   9.2  </code>
<code>17.|-- 172.68.116.2               0.0%    10  112.0 120.8 112.0 134.9   7.2  </code>
<code>18.|-- one.one.one.one            0.0%    10  116.3 125.0 116.3 130.6   4.8 </code>
<code>```</code>Code language: HTML, XML (xml)
In the above example, you can see that multiple hops are traversed before reaching the destination, 1.1.1.1. It takes approximately 120ms to reach the first hop, but there’s a large standard deviation, indicating noticeable fluctuation. However, by the time the signal reaches 1.1.1.1, the latency stabilizes around 120ms with minimal deviation. This suggests that the delay and fluctuation are primarily concentrated in the path leading to the first hop.
That being said, networks are always evolving, with backend configurations developing behind the scenes—often without users noticing. While these changes generally have no impact on users, there are cases where devices malfunction due to unexpectedly fast connections. Regular monitoring at the IP layer can also help detect changes in routing paths.
Monitoring the Cellular Layer
In the cellular layer, it is beneficial to monitor metrics that reflect the interaction between devices and base stations.
For LTE (the most commonly used Radio Access Technology for IoT), it is recommended to collect the following data:
1. RSRP (Reference Signals Received Power)
RSRP indicates the power level of the LTE signal received by a device. A high RSRP value signifies that the LTE signal is being efficiently received, while a low value suggests some inefficiency and poor signal conditions. This metric is often associated with what is commonly referred to as “bad signal.”
- Range: RSRP values typically range between -44 dBm and -140 dBm, with values closer to -44 indicating better signal conditions.
- Real-World Observations: In most practical scenarios, RSRP values are generally around -80 dBm.
2. RSRQ (Reference Signal Received Quality)
RSRQ measures how good the LTE signal is by comparing the useful signal strength (used for communication) to the total signal received, while also considering how the network divides resources for different users. Simply put, this metric tends to drop when LTE communication is congested due to the presence of other devices.
- Range: RSRQ values typically range between -3 dB and -19.5 dB, with values closer to -3 indicating better signal quality.
- Real-World Observations: RSRQ values are generally around -10 dB in practical use.
3. SINR (Signal-to-Noise Ratio)
SINR represents the ratio of usable LTE signal power to the noise power received by the device. It provides a direct indication of how much of the received signal is usable versus degraded by noise.
- Range: SINR values usually fall between 20 dB and 0 dB, where higher values (closer to 20 or above) indicate a better communication environment.
- Real-World Observations: SINR values around 10 dB are common in real-world settings.
- Key Note: Even if RSRP is strong, poor SINR can result in suboptimal communication.
What About RSSI?
The Received Signal Strength Indicator (RSSI) measures the total power received by the device, including both the useful signal and unwanted noise or interference. While a high RSSI might seem favorable, if the proportion of noise is significant, communication can still be unstable. Conversely, low RSSI values might indicate overall poor signal reception. While RSSI can be a useful reference for diagnosing connectivity issues, it is less specific than RSRP, RSRQ, and SINR, and is thus used as a supplementary metric when analyzing poor RSRP or RSRQ values.
Methods for Collecting Metrics
1. SNMP (Simple Network Management Protocol)
For devices like LTE routers, metrics can often be collected via SNMP. For instance, the Teltonika RUT241 provides a Management Information Base (MIB) that can be utilized for monitoring through systems like Zabbix. If your LTE router supports SNMP, this protocol is a convenient way to automate metric collection and integrate it into your monitoring setup.
2. AT Commands
For modem modules, it’s often possible to retrieve key parameters using AT commands. Please consult your product vendor for details on specific commands supported by your device.
Here, we’ll use the Soracom Onyx, as an example. The EG25 supports retrieving various metrics through the following AT command:AT+QENG="servingcell"
Which will then return a response such as:+QENG: "servingcell","NOCONN","LTE","FDD",440,10,2734xxx,14x,9510,28,3,3,1684,-91,-6,-68,18,-
In the example above, the values are RSRP: -91, RSRQ: -6, and SINR: 18 (for detailed specifications of the command, please refer to the AT Command Reference published by the modem manufacturer).
Regularly measuring and collecting these values can help identify trends and pinpoint the causes of issues as they arise. For instance, if a communication error occurs and RSRP deteriorates, it might indicate changes in the device’s installation environment or, in the case of mobile devices, that it has entered an area with poor signal reception. A drop in SINR could suggest an increase in environmental noise.
In addition to these three parameters, it is also recommended to collect data on the serving base station and bandwidth. This additional information can help you further isolate issues. For example, when throughput is low, it becomes easier to determine whether the root cause lies in the wireless layer or elsewhere.
Metrics can also be sent to Soracom Harvest, Soracom’s data collection and visualization service for devices using IoT SIMs. This data can then be viewed directly in Soracom Harvest, or forwarded to Soracom’s customizable dashboard service Soracom Lagoon.
Approach to Alerts
Since cellular connections can be interrupted, it may not always be possible to collect the metrics discussed earlier in real-time through a monitoring system. Therefore, in addition to threshold-based alerts, it’s advisable to implement a mechanism that triggers alerts when the monitoring system fails to retrieve the target metrics. This ensures that connectivity issues or other disruptions are flagged promptly, even when the system is unable to collect the expected data.
For optimal device performance and connection quality it is also important that devices follow best practices. Soracom provides a Device Implementation Guide that may answer questions more thoroughly.
Conclusion
In this article, we explored various aspects of monitoring cellular connections in IoT systems. If you have suggestions, such as additional metrics to monitor or better approaches, we would love to hear your feedback.
For further reading on best practices for integrating your device with Soracom’s connectivity services, please refer to our Device Implementation Guidelines. This guide provides key recommendations to ensure optimal performance, reliability, and compatibility with Soracom’s network.
Wishing you all success in maintaining stable and reliable IoT systems.
This article is a translation of a piece from our Japanese team, it has been updated to reflect a western audience.
………………
Got a question about Soracom? Whether you’re an existing customer, interested in learning more about our products and services, or want to learn about our Partner program – we’d love to hear from you!


MORE LIKE THIS


What is Soracom?
Discover why technology innovators choose Soracom for connecting their
devices to the cloud over cellular.

Soracom's Picks
Advices and interviews, to inform and inspire.


The Bill Shock Prevention Checklist: 4 Ways to Stop Idle Connectivity Spend and Overage
Whilst theft accounts for over $1 billion dollars in losses…

IoT Connectivity for Construction Sites: Fiber vs. Satellite vs. Cellular (4G/5G)
The Site Manager’s Dilemma: Speed vs. Stability vs. Security When…

Why Network-Agnostic Connectivity is the Lifeblood of Physical AI
In the world of enterprise IoT, we are witnessing a…


Champion in IoT
Connectivity Management
Soracom Named as a Champion for IoT Connectivity Management in 2023 Kaleido Intelligence Connectivity Vendor Hub